 In this second part we continue to analyze some of the assumptions that applications use to model the hydraulic system and the electrical consumption of pumps.
by Julio Londoño*
In this second part we continue to analyze some of the assumptions that applications use to model the hydraulic system and the electrical consumption of pumps.
by Julio Londoño*
After observing in the first part of this article how control valves work by means of a modeling to obtain significant savings in hydraulic air conditioning systems, we will continue to analyze some technical aspects such as the creation of new curves for the distribution bmba.
Create new curves for the distribution pump: In order to create a new curve for the pump, a new group of assumptions must be established that allow us to calculate the excess flow generated by the pressure-dependent valves. The following methodology is based on an article written by Mack Wallace for ASHRAE (McHenry Wallace Jr. PE, A New Approach to Modeling Pressure Dependent Control Valves published by ASHRAE, white paper).
New Assumption-1
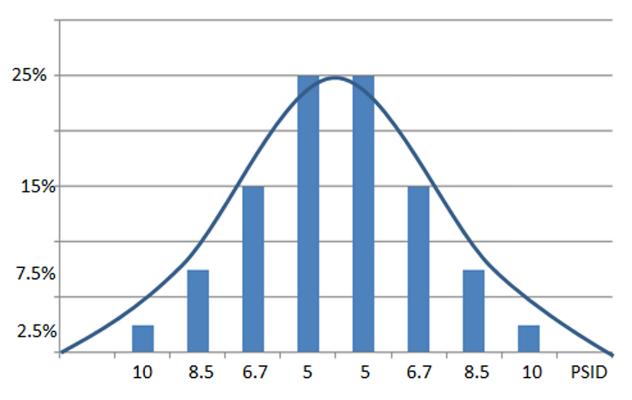
The pressure through the valve fluctuates between 5-10 psi: Using the behavior area of the pump head (shown in Figure 2 in the previous article) and starting from the fact that you have a well-balanced system with well-selected valves we assume that these are normally subjected to pressure fluctuations in the range of 5 to 10 psi. This assumption allows us to calculate the excess flow for each valve position.
To create the new pump curve we first calculate the flow values for each valve position at different differential pressures. Then to obtain the consumption of the pump in each position we use the affinity law of the pumps.
New Assumption-2
The differential pressure through the valve has a normal distribution between 5-10 psi: To obtain the values of the pump consumption for each position of the valve we use a weighted average assuming a normal distribution of the differential pressure. In order to define the equations as a percentage, each average is then normalized against the values of a specific valve.
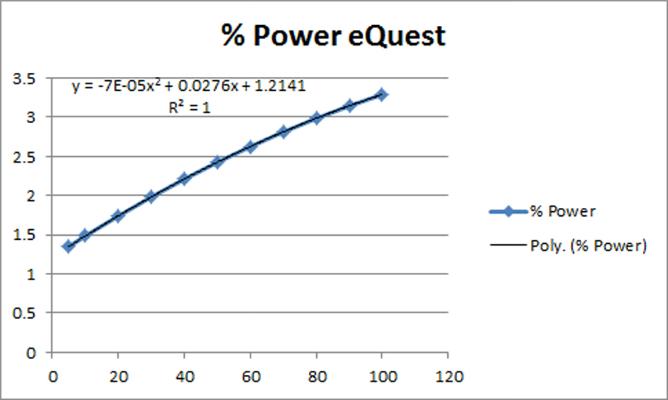
 The curve of the weighted averages is plotted in a spreadsheet and with the graphical tools you can find the equations of the graph and the coefficients of each variable. These coefficients are entered into the configuration of the pump curve according to the requirements of each modeling package. For example, Trane's Trace 700 uses a fourth-degree polynomial curve, and DOE's eQuest uses a quadratic equation.
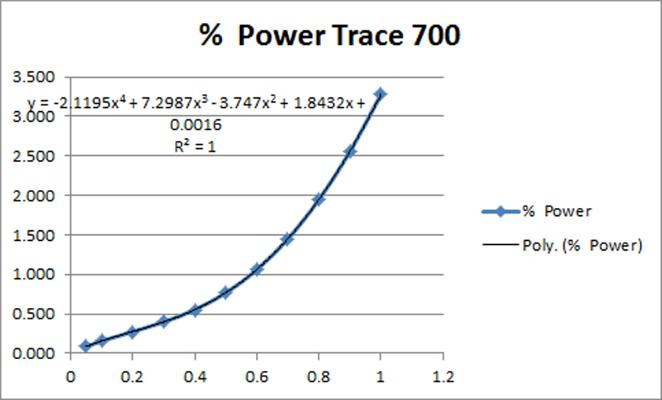
Using the new curves
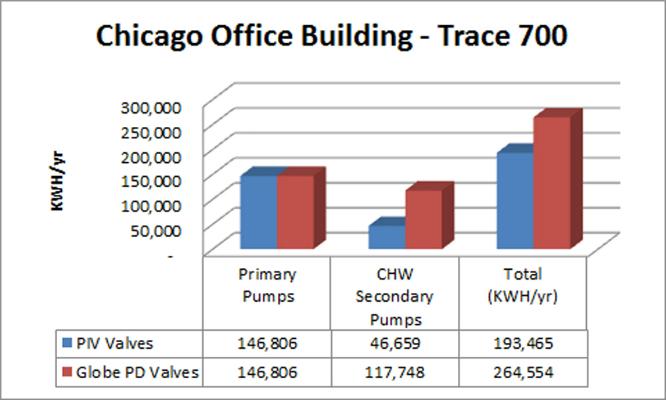
We set up a new pump in eQuest and Trace 700 using the coefficients given in the graphs. We then compared the results using a model of a typical five-story office building in Chicago, with an area of 750,000 sq.ft. The cooling system is of the decoupled type, also called primary/secondary, with two water-cooled chillers, of 1,000 tons each, with dedicated constant volume pumps for each cooler and a variable volume pump for distribution. These were the results:
Using Trace 700:
Figure 13
 Using eQuest:
Figure 14
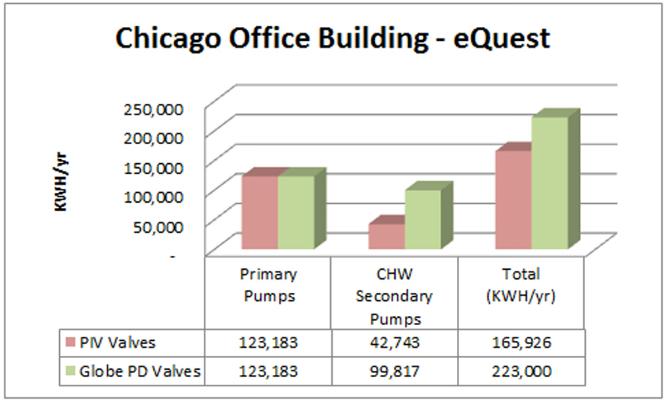 In each case the building was modeled using as a basis the basic curves included in each package, this option corresponds to ideal conditions in the hydraulic system when installing independent pressure valves. The building was then modeled using the new curves to obtain electricity consumption using pressure-dependent valves.
In both cases, an increase in the consumption of the distribution pumps of around 35% was obtained. This value is very close to the values that have been obtained in real systems when valve retrofits are made and conventional valves are replaced by pressure independent valves. This value varies depending on the type of building, its construction and its geographical location.
Conclusions
In each case the building was modeled using as a basis the basic curves included in each package, this option corresponds to ideal conditions in the hydraulic system when installing independent pressure valves. The building was then modeled using the new curves to obtain electricity consumption using pressure-dependent valves.
In both cases, an increase in the consumption of the distribution pumps of around 35% was obtained. This value is very close to the values that have been obtained in real systems when valve retrofits are made and conventional valves are replaced by pressure independent valves. This value varies depending on the type of building, its construction and its geographical location.
Conclusions
It is important to recognize that this method is very conservative and is more appropriate for new building designs, because in existing buildings it is possible that the valves can see greater pressure fluctuations, leading to much larger savings.
The reasons for these wider pressure fluctuations are manifold, some may be that the building is not well balanced, that the control valves have not been properly selected or that the coils no longer offer the same original heat exchange. This model also does not include the inefficiencies caused in the cooling plant due to poor heat exchange in the coils and low delta T syndrome.
That is why it is very important that the engineer in charge of modeling knows the impact on energy efficiency according to the type of valves installed and the current conditions of the building.
*Julio Londoño is the Product Manager of Belimo more information in [email protected]